
But I made some graphs of my run. Because I'm obsessed with graphs and charts.
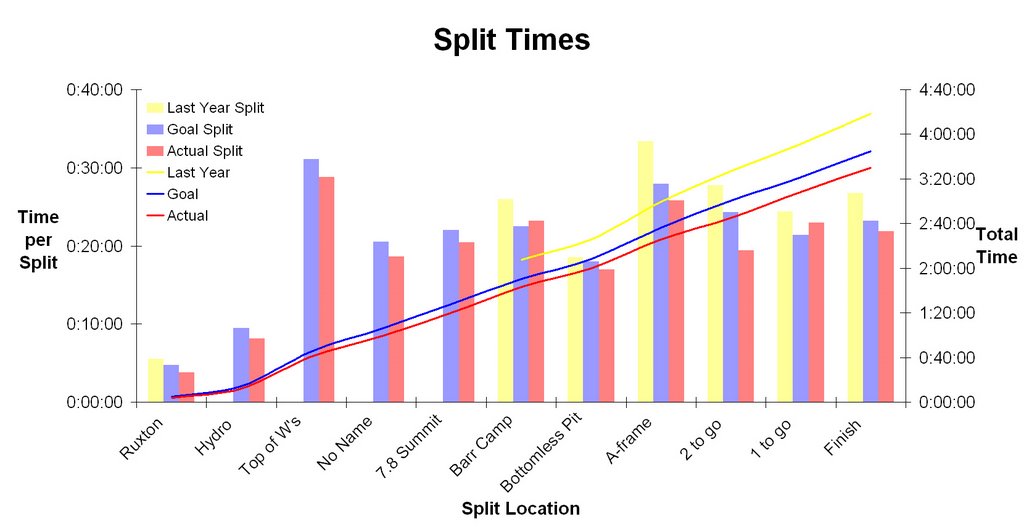
The first shows my split times during the run. The line is my cumulative time. The bars are the times for each split.
This next one shows my speed over the course of the run, compared with my goal and last year.

This last one is the big daddy. I was watching it grow all year. It shows every run I've done this year. All 101. The pace per mile is graphed on the vertical axis, and the date is on the horizontal axis. The width of each inner circle corresponds to the distance of the run. The distance between the inner and outer circle shows the elevation gain of the run.


And here's something extra.
link
2 comments:
I rode in an elevator with Ty Pennington today and told him to settle down.
North Dakota is only slightly better than NC.
-cube neighbor
Honey you rock. I like the bubble chart. And you're right, it's a good song.
Love, Heather
Post a Comment